
If you're comparing AI support vendors, resolution rate is the number most lead with. It's also a metric that none of them measure the same way. Say that two vendors both tell you they hit an 85% resolution rate. One counts a case as resolved the moment the chat closes; the other counts it only when the customer's problem is fixed and stays fixed. The headline is identical, but the value behind it is completely different. An AI resolution rate benchmark only helps once you know how the rate was measured, what it covers, and where a good number should land for your mix of cases. This guide sets the benchmarks by approach and by case type, then gives you a way to compare vendor claims like-for-like, so you buy on the number that reflects real work done, not tickets closed.
What an AI resolution rate benchmark actually measures
Ideally, a resolution rate is the share of cases an agent actually solves, out of the cases it handles. It sounds simple, but three things move the number before you even look at performance: what counts as a case, what counts as solved, and over what window you measure.
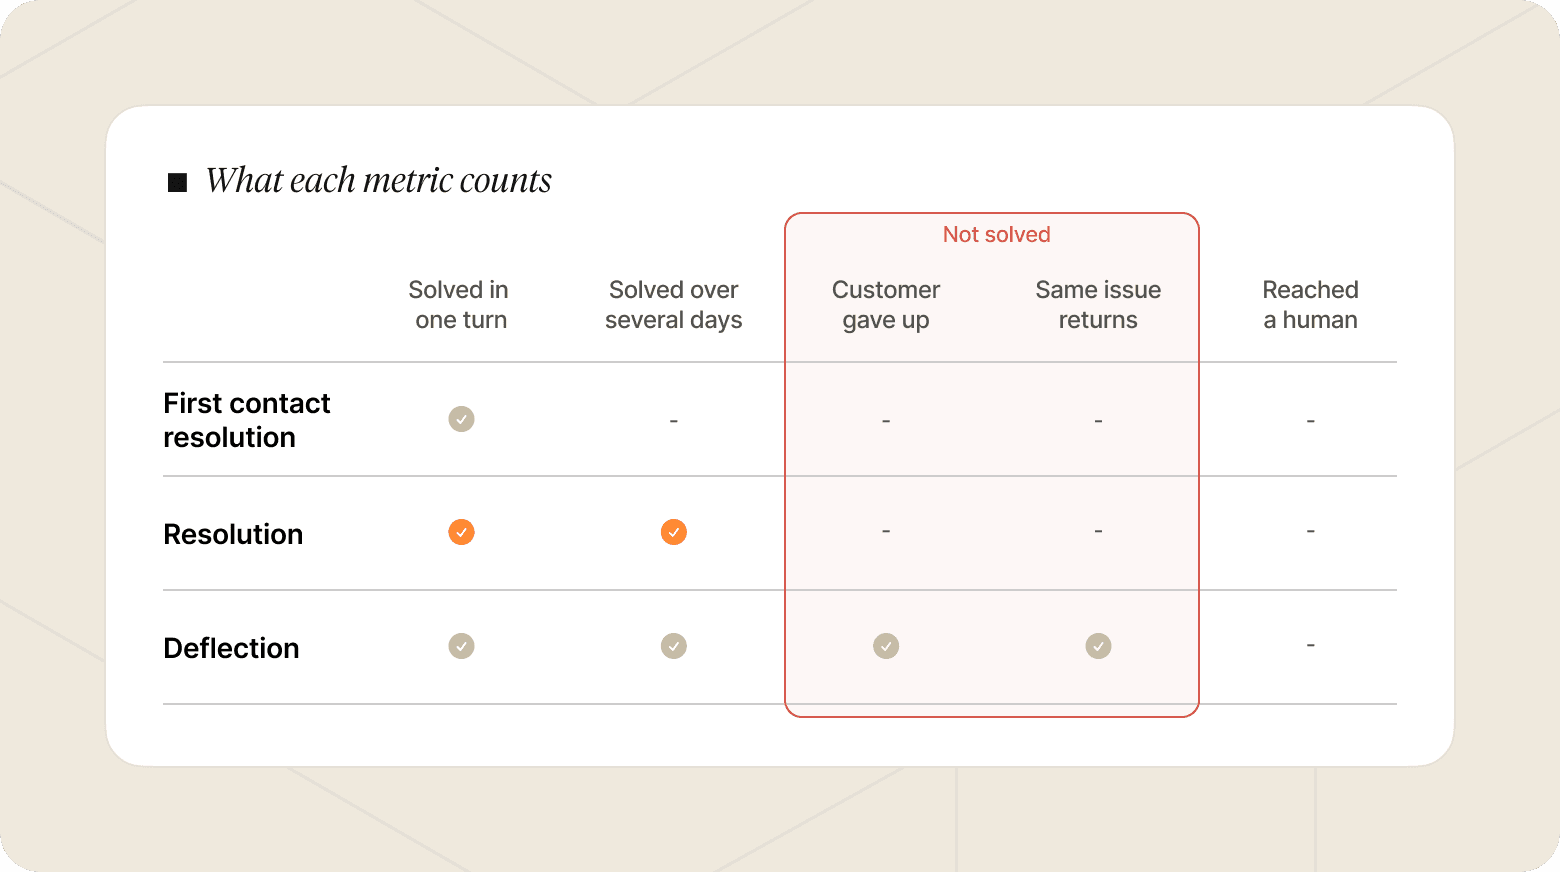
That is also what separates it from the metrics it gets confused with. Deflection and containment count contacts that left the queue without a human, whether or not the underlying problem was solved. First contact resolution (FCR), the traditional contact-centre metric, counts only what gets fixed in a single interaction, which undercounts any case that legitimately runs across several days. A resolution rate sits between the two: broader than FCR because it credits multi-step cases, and stricter than deflection because a closed chat with an open problem behind it earns nothing.
Because no regulator or standards body defines resolution for AI support, every vendor draws these lines slightly differently. A benchmark only means something once you know where each vendor drew them, which is what the rest of this guide helps you work out.
What good looks like: AI resolution rate benchmarks by approach
There is no single industry-standard resolution rate for AI customer service, but the realistic ranges cluster by how the work is handled. The table below sets the rough benchmarks, then the sections underneath show why a blended figure hides more than it tells you.
Approach | Typical resolution rate | What drives it |
|---|---|---|
Human teams | Near-complete on the cases they own | The quality bar to beat, but capped by headcount and cost. Human agents at Zego scored 61% CSAT against the AI agent's 77% |
Generic horizontal AI chat | Plateaus around 60–65% on a complex operation | Handles discrete questions well and stops at the reply, so the harder cases stay manual |
Specialist AI agents for financial services | Around 50–60% on day one, 80–90% when mature | Runs the back-office work behind the case, so resolution keeps climbing past the frontline ceiling |
In-house build | Varies widely with engineering investment | Full control, but slow and expensive to reach the mature range and hold it there |
Two numbers in that table matter most. The 60–65% plateau is where tools built for discrete questions run out of road: the expensive, repetitive cases live in back-office work those tools were never built to finish, so the rate stops climbing once the simple questions are gone. The move from a day-one figure to a mature 80–90% is not automatic either. It comes from a delivery model that lifts the rate over months, which is a journey from pilot to production rather than a number frozen at launch. When a vendor quotes a single figure, ask whether it is a day-one rate or a mature one, because the two describe very different stages of a deployment.
Why a blended resolution rate misleads
A single resolution rate averaged across every case type is the easiest number for a customer support automation vendor to quote and the least useful to compare. An 80% blended rate could mean the agent resolves four out of five of everything, or it could mean it clears the easy questions and forwards the hard ones. Segmenting by case type tells you which.
Case type | Examples | Realistic resolution |
|---|---|---|
Simple frontline | Password reset, "where's my statement?", balance check | High across almost every tool |
Complex, long-running | Disputes, collections, KYC review, complaints | Low for frontline-only tools, high only for agents that run the case end to end |
That gap is what a blended number hides. Simple frontline cases close in a single turn, so they lift a blended average while removing little real workload. The complex cases run across days, channels, and systems, and they are where the manual cost actually lives. When you ask a vendor for their resolution rate, ask for it broken out by case type, and weight the answer towards the cases that fill your own queue. A vendor that quotes 85% blended but 40% on disputes is telling you exactly where it will and won't help.
How to compare vendor resolution rates like-for-like
Once you have a number from each vendor, normalise it before you compare. Two rates are only comparable when they were measured the same way, and these six lines are where they usually diverge:
The denominator: resolved out of total contacts, or resolved out of the cases the agent chose to attempt? Attempted-only denominators quietly inflate the rate by excluding everything the agent passed on.
The definition of resolved: customer-confirmed, or system-closed? A case marked resolved because the session timed out is not the same as one the customer said was fixed.
The measurement window: counted at case close, or after a re-contact window has passed? A rate taken at the moment of close credits cases that bounce straight back the next day.
Re-contacts: does the same issue returning as a new ticket still count as resolved, or does it reverse the original? If re-contacts don't reverse it, one unsolved problem can count as resolved two or three times.
Human-in-the-loop: does an outcome the agent prepares and a human approves count as an automated resolution? Be consistent across vendors, because for back-office work this is often the right operating model rather than a caveat.
Scope: which case types are in the denominator at all? A rate measured only on frontline chat cannot be compared with one measured across disputes and collections.
Normalise every vendor to one definition, then rank them on that. Pairing this with a structured vendor evaluation stops a strong headline number from carrying a weak product through your shortlist, and it turns a set of incomparable marketing figures into one league table you can actually decide on.
The metrics that keep a resolution rate honest
Read a resolution rate next to the metrics that move the opposite way to determine if the number is being inflated. If resolution climbs while any of these slip, the rate is measuring deflection rather than outcome.

CSAT: the fastest tell that "resolved" cases weren't. A good AI agent holds or beats the human bar. At Zego, the AI agent reached 77% CSAT against 61% for human agents, so higher resolution came with happier customers, not fewer.
QA score: for regulated work, whether each resolution was reached correctly matters as much as whether it closed. At a large European digital bank, the agent cleared 500,000 conversations at a 98% QA score, ahead of the bank's own analysts.
Re-contact rate: the share of resolved cases that come back within a set window. A resolution rate that ignores re-contacts is measuring how many customers gave up, not how many were helped.
Handling time and SLA: for back-office cases the customer never sees, these replace CSAT as the proof the case was closed correctly and quickly, not simply closed and forgotten.
Ask every vendor which of these they report alongside their resolution rate. A vendor that only ever shows you the one number is choosing the number that flatters it.
Resolution rate benchmarks in financial services
Benchmarks only mean something against real deployments, so here is where the numbers land in practice. On day one, a specialist agent that covers the back office resolves around half of what it handles: Gradient Labs’ customer Morse hit a 50% resolution rate from day one. The mature range sits at 80–90%, reached over months as the delivery model tightens and more case types come into scope.
Plum, a UK neobank, points at the pairing that matters when you benchmark:
"Gradient's AI solution delivered impressive results with minimal effort on our part... Seeing such a high CSAT and resolution rate validated our choice."
Yoan Yedrowiak, Head of Customer Success, Plum
The reason the number keeps climbing past the frontline ceiling is structural. Gradient Labs is the AI-native customer operations platform for financial services, built to resolve cases end to end rather than deflect them. The same agent runs the frontline conversation and the back-office work behind it, so a case doesn't stall at the point a frontline-only tool would hand it to a human. On the outbound side, SteadyPay puts 33,000 collections calls a month through the agent and turns 60% of engaged customers into a firm repayment commitment, all inside FCA rules. That is resolution reaching work a deflection rate never counts.
There is a regulatory case for benchmarking on resolution rather than deflection, too. The FCA's Consumer Duty judges firms on the outcomes customers actually get, and a resolved case is an outcome in a way a deflected one is not. Miss it and the cost surfaces later: a case the customer still counts as open can escalate to the Financial Ombudsman Service, which charges a fee per referral before fault is even decided. Benchmarking on resolution keeps the number you optimise for aligned with the outcome you are held to.
See resolution measured the right way
If you want to benchmark resolution against your own hardest cases, book a demo and bring your real case mix, whether that is disputes, collections, or verification, and see the rate measured on work actually finished.


Elizabeth Shew leads Brand and Advocacy at Gradient Labs, where AI agents handle customer support and back-office work for banks, lenders, and fintechs. Before that, she led customer marketing at Mastercard and built Dynamic Yield's customer marketing programme from the ground up, a decade spent turning customer results into industry-shaping stories. She writes about how support and operations teams actually put AI and technology to work. Before tech, she was a professional dancer in NYC.